Dividend harvesting is a straightforward strategy to model: it typically assumes that shares are purchased after a dividend announcement, held through the first ex-dividend date, and later sold while retaining the right to receive the dividend. The outcome depends on whether the dividend offsets any share-price decline and the transaction costs incurred during the holding period.
If you subscribe strictly to the Efficient Market Hypothesis, you may be tempted to close this tab here. After all, shouldn't the price fall by exactly the amount of the dividend on the first ex-date? Maybe. In thinly traded markets with strong demand for a stock—both common conditions in Central and Eastern Europe—the price adjustment may be smaller than the dividend, may occur gradually, or may not be immediately observable.
A high dividend yield is not enough. The real question is how quickly the share price recovers after the stock goes ex-dividend.
— CEEWire Research Desk
From investment thesis to a Playbook
As shown on our product roadmap, we recently introduced Playbooks: text-based instructions that define what an agent should do. A Playbook can be as simple as “Summarize this notification,” or as detailed as an investment strategy with explicit data requirements, calculations, constraints, and output instructions.
Typical Playbooks can ask the agent to:
- •summarize a regulatory notification;
- •create a five-year revenue table and calculate operating margins;
- •evaluate whether a company satisfies a defined investment strategy; or
- •turn the completed analysis into a research note visible for everyone in the organization.
All of these workflows are grounded in publicly available data, structured so that agents can use it effectively. I will cover our approach to data in a separate post.
Before and after AI
The pre-AI workflow
Traditionally, this analysis meant opening Excel, connecting to a market-data terminal, and searching documentation for the right datasets. At a minimum, the analyst needs:
- 1.security price history;
- 2.dividend history and nominal dividends per share;
- 3.dividend announcement dates;
- 4.record dates and first ex-dividend dates; and
- 5.a consistent method for calculating recovery periods and returns.
Retrieving those inputs might require several separate Bloomberg, S&P Capital IQ, or equivalent vendor formulas. After locating and importing the data, the analyst still has to calculate returns, test whether the thesis holds, and write a research note explaining the findings.
The hard part is defining the thesis and testing it. Yet a large share of the work comes afterward: capturing spreadsheet output, formatting the note, linking evidence, and making the result accessible to colleagues.
The AI-enabled workflow
In an AI-enabled workflow, the analyst focuses on the strategy, the investment thesis, and the constraints. Data discovery, calculation, and note preparation can be delegated to an agent designed for the task.
The CEEWire Agent has access to reliable, vetted data in a structure designed for language models. The strategy below is the Playbook I used for this analysis.
### Hypothetical research scenario

Test a hypothetical scenario in which the company's shares are purchased
after the dividend announcement, the dividend entitlement is captured, and
the position is exited relatively soon after the first ex-dividend date.

### Success conditions

- Assume a 1.2% round-trip transaction cost: 0.6% to buy and 0.6% to sell.
- Exclude opportunities with a dividend yield below 5%.
- If the ex-date is unavailable, estimate it as 10 calendar days after the
  announcement date.
- Assume the shares are purchased three days after the announcement.
- Treat the trade as successful if the entry price is recovered no later than
  one month after the ex-date.

Analyze the company's dividend history over the past five years. Return a
table containing the announcement date, first ex-date, nominal dividend per
share, dividend yield, minimum days to price recovery, and price ratio.

If the price has not recovered within one month, report the price observed one
month after the ex-date. Summarize whether the historical data would have
satisfied the stated screen, then create a research note in the General
project and make it visible to every member of the organization.
This requires no vendor-specific formulas, no switching between multiple tools, and no manual copying and pasting. Once the research note is created, it remains available as context for later agent interactions and can be shared across the organization.
What the agent found
I ran the Playbook against two listed companies: EAC (Elana Agrocredit AD) on the Bulgarian Stock Exchange and GPW (Gielda Papierow Wartosciowych w Warszawie SA) on the Warsaw Stock Exchange.
EAC: attractive yield, mixed recovery
The yield hurdle was met in every completed year, and the gross yield also cleared the 1.2% transaction-cost hurdle. The one-month exit rule produced a mixed result:
- •Weak: 2021 and 2022, when the price did not recover within 30 days.
- •Acceptable: 2023, 2024, and 2025, with recovery in 18–27 days.
- •Not observable at publication: 2026. This row is included only to show how the screen handles a current event; it is not an instruction to trade around the 2026 dividend.
The back-test would have satisfied the screen for EAC in individual years, but the history is not reliable enough to treat it as a consistent pattern on its own.
GPW: a stronger historical back-test result
Announcement dates reflect the dividend proposal or resolution timing found in the available dividend filings. When the price did not recover within one month after the ex-date, the agent used the price level one month after the ex-date. For 2024, that was PLN 39.839 on August 26, 2024, versus the PLN 39.6976 announcement-date benchmark, producing a price ratio of 1.0036, equivalent to a return of approximately 0.36%.
Four observations stand out:
- 1.Every year passed the yield test. Observed yields ranged from 6.97% to 9.18%, clearing both the 5% attractiveness threshold and the 1.2% transaction-cost hurdle.
- 2.Recovery was usually fast. In four of five years, the share price returned to the assumed entry price within 11 calendar days.
- 3.2024 was the exception. The stock did not recover to the assumed entry price within one month, so it failed the Playbook's strict timing rule.
- 4.The historical success rate was relatively strong. Four of five observed years met the one-month recovery rule.
GPW produced the stronger historical back-test result under these assumptions: high yields were consistent, and the assumed entry price recovered quickly in four of the five observed years. The result is encouraging, but not reliable in every period.
— CEEWire Agent assessment
The historical screen is therefore stronger for GPW than for EAC, subject to two important caveats. First, the 2024 result shows that event risk and market risk remain even when the historical pattern is favorable. Second, the Playbook did not include dividend tax; the investor's net dividend yield may be materially lower than the gross figures shown here.
Source-level citations
The cite-x notation in the agent output is more than a database reference. Inside the platform, each citation links to the exact location in the regulatory document filed by the company, allowing the analyst to inspect the primary source behind a number or claim.
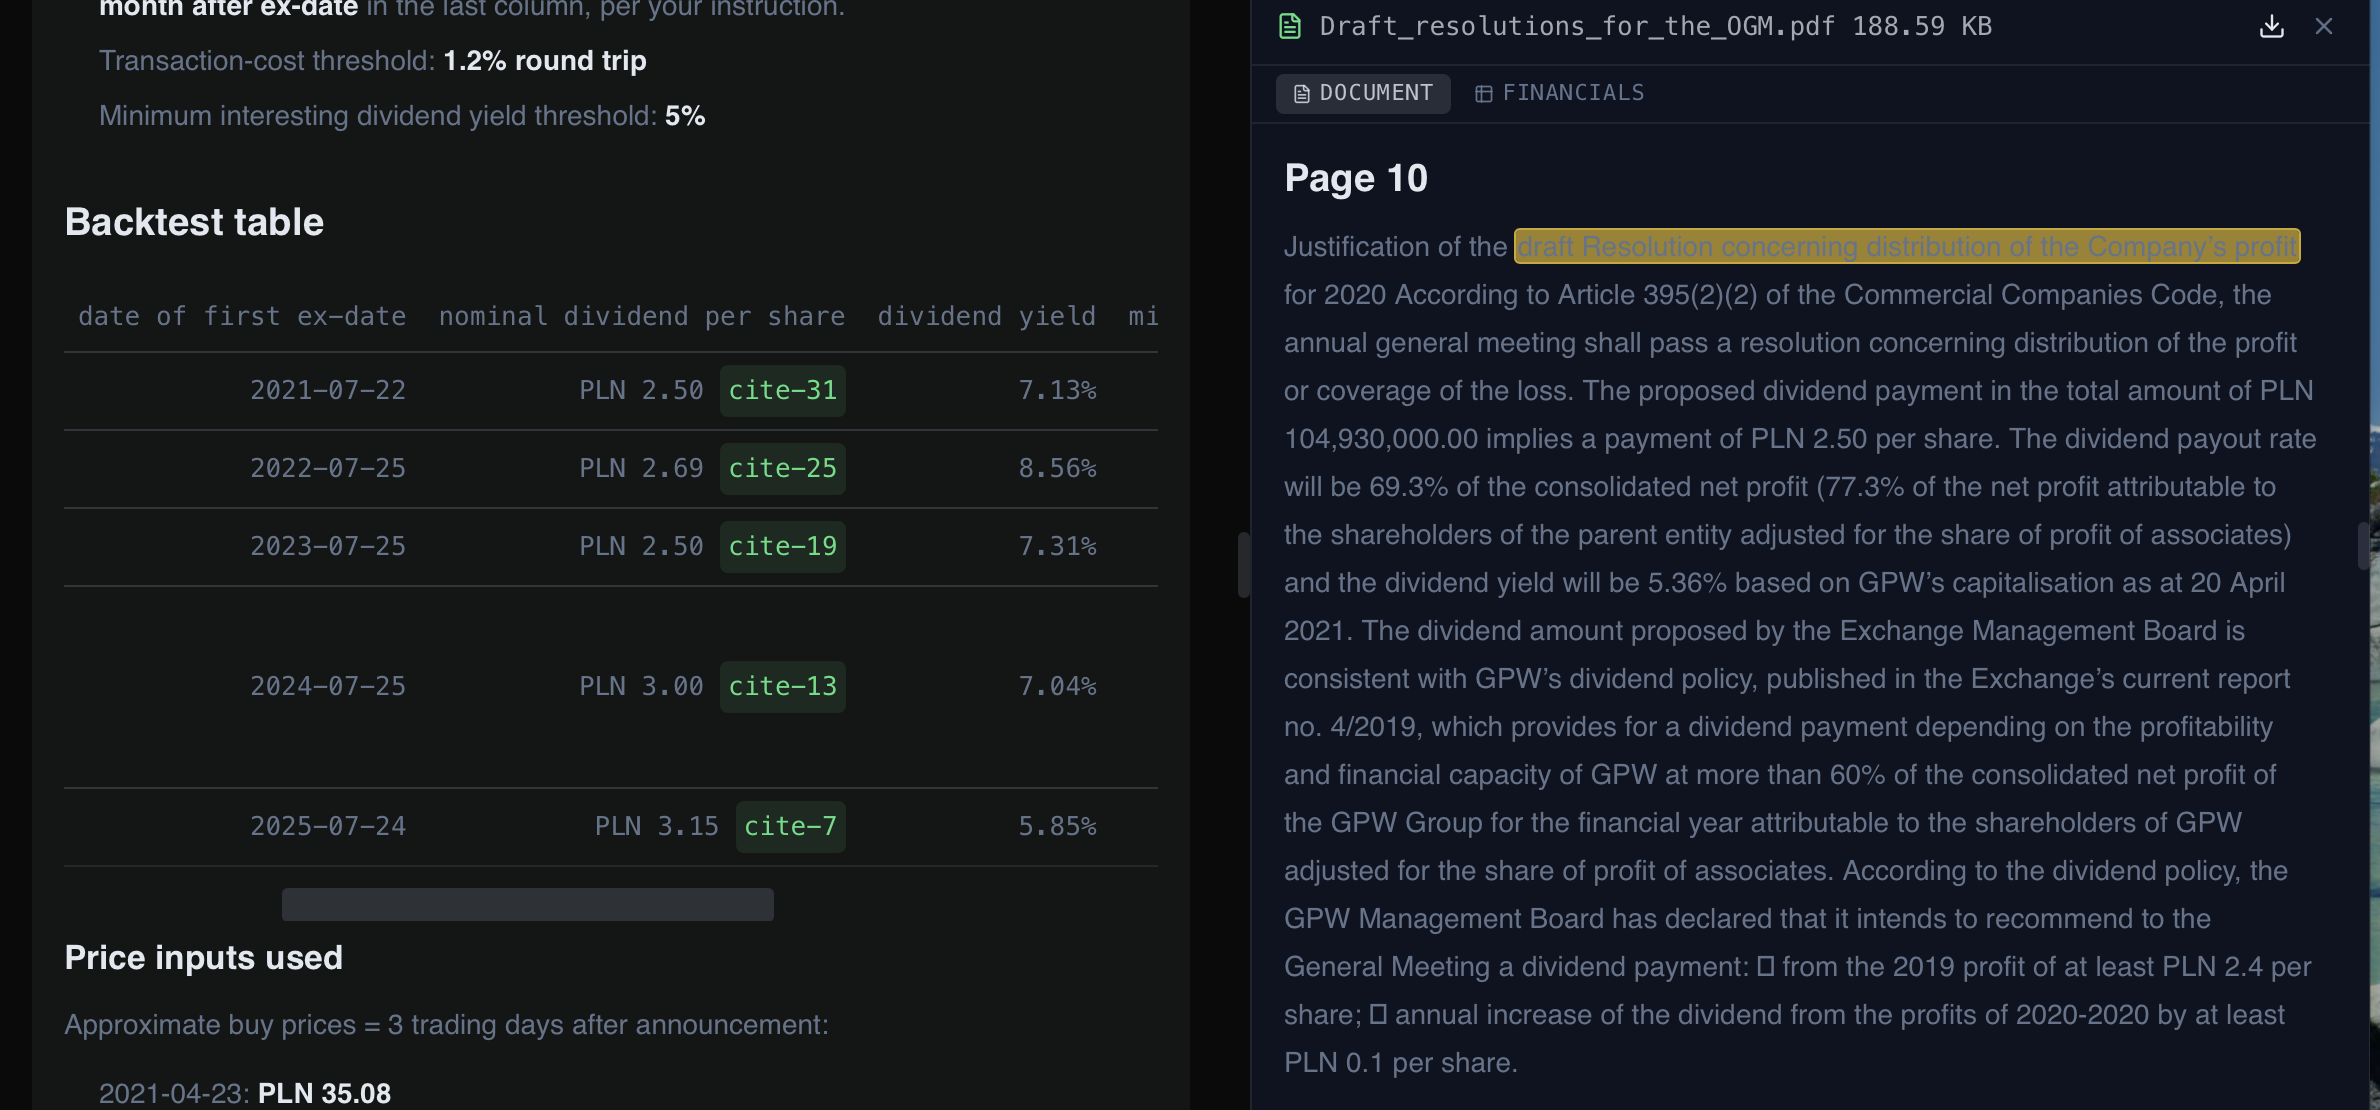
This traceability matters. An agent-generated result should not replace professional judgment; it should make the underlying evidence faster to find and easier to challenge.
Takeaways
A properly implemented AI system enables financial professionals to do more—not less. The lasting advantage remains with analysts who can:
- •define a coherent investment thesis;
- •express assumptions and constraints precisely;
- •challenge the agent's calculations and conclusions; and
- •verify material claims against primary-source evidence.
That requires a more knowledgeable workforce, not a less knowledgeable one. The agent reduces process friction; the professional remains responsible for the quality of the question and the decision that follows.
This analysis was completed using the CEEWire AI agent and a reusable Playbook. For more information about the product or to request a product demo, reach out to [email protected].